SIMULATE A 3 LEVEL NESTED EXPERIMENT
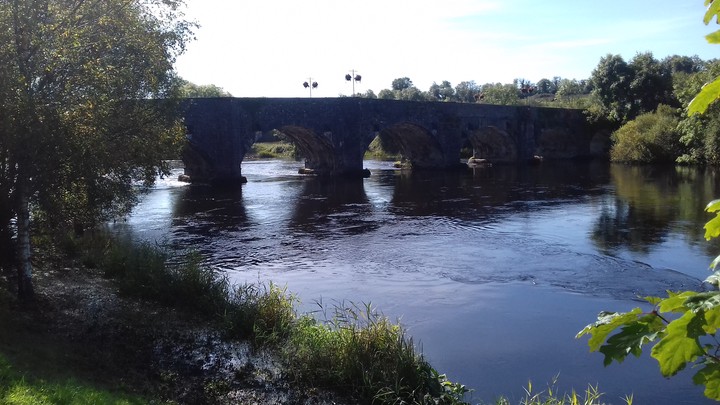
 View of the river Shannon
Frequentist variance component modelling and a plot of the data. A choice of plots is given, a base plot or a plot using the VCA package (VCA plot shows individual data points rather than boxplots of replicate distributions). A choice of modelling is given, estimation using nlme or VCA package. This is an improvement over the SIMULATE, PLOT AND ANALYSE A 3 LEVEL NESTED STUDY app, the plots are nicer and unbalanced designs can be simulated.